Ages of Y-STR variation within Y-chromosome haplogroups in East Asia
Источник: Extended Y-chromosome investigation suggests post-Glacial migrations of modern humans into East Asia via the northern route. Zhong 2010
Источник: Extended Y-chromosome investigation suggests post-Glacial migrations of modern humans into East Asia via the northern route. Zhong 2010
Haplogroup    Age ± SE in kya (n)

F2-M427 [a] 	2.42 ± 1.96 (15)
G1-M285 [b] 	14.79 ± 4.77 (7)
G2a-P15 [b] 	14.58 ± 2.90 (66)
H1-M52 [b] 	9.68 ± 2.07 (167)
J1-M267 [b] 	23.11 ± 11.34 (344)
J2a-M410 [b] 	17.83 ± 4.63 (176)
J2a1-M322 [b] 	5.18 ± 2.42 (7)
J2a2-M67 [b] 	12.89 ± 2.39 (52)
J2a8-M319 [b] 	8.05 ± 4.44 (18)
J2b-M12 [b] 	12.14 ± 2.58 (69)
J2b2-M241 [b] 	13.86 ± 3.15 (49)
L2-M317 [b] 	12.45 ± 2.47 (6)
L3-M357 [b] 	7.93 ± 2.43 (24)
Q1a1-M120 [a] 	15.42 ± 7.25 (61)
Q1a2-M25 [b] 	2.72 ± 1.24 (5)
Q1a3a*-M346 [b] 	17.77 ± 4.41 (13)
R1a1*-M17 [a] 	15.37 ± 3.46 (84)
R1b-M343 [b] 	17.35 ± 4.53 (338)
R2-M124 [b] 	11.73 ± 1.67 (100)
T-M70 [b] 	15.40 ± 1.35 (14)
C1-M8 [a] 	9.96 ± 3.54 (20)
C3*-M217 [a] 	18.78 ± 4.19 (374)
C3c-M48 [a] 	9.31 ± 2.85 (18)
C3d-M407 [a] 	9.47 ± 2.71 (22)
C3e-P53.1 [a] 	4.83 ± 2.34 (15)
D*-M174 [e] 	50.62 ± 16.60 (44)
D1-M15 [a] 	32.67 ± 6.28 (233)
D2-M57 [a] 	16.27 ± 3.33 (106)
D3-P47 [a] 	12.97 ± 3.35 (282)
O1a*-M119 [f] 	35.05 ± 4.58 (346)
O1a2-M110 [f] 	39.93 ± 11.55 (21)
O2a*-M95 [f] 	41.10 ± 7.61 (343)
O3*-M122 [a] 	37.24 ± 4.56 (27)
O3a*-M324 [a] 	39.29 ± 5.03 (355)
O3a3b-M7 [a] 	41.74 ± 7.00 (88)
O3a3c1*-M133 [a]	29.23 ± 5.47 (242)
O3a3c-M134 [a]	35.32 ± 4.66 (139)


[a] including East Asians only; [b] including individuals from East Asia, CSA and WE;
[e] including East Asians and Andamanese; [f] including East and Southeast Asians.
The numbers (n) in brackets are sample size.
Age of Microsatellite Variations within Various Y HGs in India
Источник: Polarity and Temporality of High-Resolution Y-Chromosome Distributions in India Identify Both Indigenous and Exogenous Expansions and Reveal Minor Genetic Influence of Central Asian Pastoralists. Sengupta 2006
Источник: Polarity and Temporality of High-Resolution Y-Chromosome Distributions in India Identify Both Indigenous and Exogenous Expansions and Reveal Minor Genetic Influence of Central Asian Pastoralists. Sengupta 2006
                          AGE In KYA ± SD (n) OF MICROSATELLITE VARIATION

                            |Austro-Asiatic|Tibeto-Burman|         Dravidian        |            Indo-European             |
|     HG     |    Pooled    |    Tribe     |    Tribe    |    Tribe    |    Caste   |   Tribe   |    Caste    |   Muslim   |
 C5-M356	19.4±4.2 (11)						                                   24.6±8.0 (5)
 F*-M89	        28.9±4.4 (38)			                26.7±5.7 (25)	28.1±5.3 (8)
 G2-P15	        10.5±3.9 (9)				                        8.6±3.7 (8)
 H1-M52	        10.6±1.8 (145)	  9.7±4.4 (9)                   9.8±2.0 (64)	12.6±3.8 (25) 10.9±3.6 (5) 10.0±2.1 (40)
 H2-Apt	        17.8±4.3 (16)			                11.3±6.4 (9)
 H-M69*	        30.4±7.7 (29)	  8.0±4.0 (5)			                20.9±9.5 (13)		   30.6±12.5 (9)
 J2*-M410/M158	13.7±2.9 (28)			                		15.8±5.3 (12)		   12.4±2.0 (12)
 J2b2-M241	13.8±3.8 (38)	  3.6±1.7 (7)	            		        12.1±3.4 (21)		   12.0±3.1 (9)
 L1-M76	        9.1±1.9 (46)			                6.0±2.4 (10)	7.1±2.1 (30)		   13.6±4.3 (6)
 O2a-M95[b]	11.7±1.6 (106)	  8.8±2.0 (34)	12.9±3.1 (16)	8.2±1.9 (48)	   	       8.5±3.8 (6)
 O3e-M134[c]	9.2±2.7 (58)		        9.3±2.7 (57)
 R1a1-M17[d]	14.0±3.1 (114)			                10.9±3.8 (5)	12.2±3.0 (34)		   14.6±3.5 (57)    10.5±3.0 (11)
 R2-M124	11.6±2.1 (68)	  9.8±2.4 (7)	10.1±4.3 (5)	18.1±4.6 (9)	8.9±2.3 (13)		   12.7±3.5 (28)    8.5±4.8 (6)


[b] In Cambodia, 11.9±3.5 (np 7); in China, 17.9±5.5 (np 14).
[c] In the Tibeto-Burman tribe, excluding Mizo, 6.7±2.1 (np 44); in Mizo, 15.1±7.0 (np 13); in Southeast Asia, 26.27.0 (np 27).
[d] In Pakistan, 15.6±3.0 (np 50); in Oman, 12.5±2.9 (np 11); in western Eurasia, 12.8±2.5 (np 16); in Greece, 9.3±2.8 (np 19);
in Turkey, 10.0±2.6 (np 36); in Central Asia, 11.2±5.0 (np 10).
Chronological development of haplogroups in Europe
Источник: Human Y-chromosome DNA haplogroup
Источник: Human Y-chromosome DNA haplogroup
| Haplogroup |
Possible time of origin y. a. |
Possible place of origin |
| K | 40,000 | South Asia or West Asia |
| T | 30,000 | West Asia |
| J | 30,000 | Middle East |
| R | 28,000 | Central Asia |
| E1b1b-M35 | 26,000 | East Africa |
| I | 25,000 | Balkans |
| R1a1 | 21,000 | Southern Russia |
| R1b | 20,000 | Around the Caspian Sea or Central Asia |
| E1b1b-M78 | 18,000 | Egypt/Libya |
| G | 17,000 | Between India and the Caucasus |
| I2 | 17,000 | Balkans |
| J2 | 15,000 | Northern Mesopotamia |
| I2b | 13,000 | Central Europe |
| N1c1 | 12,000 | Siberia |
| I2a | 11,000 | Balkans |
| R1b1b2 | 10,000 | North or south of the Caucasus |
| J1 | 10,000 | Arabian peninsula |
| E1b1b-V13 | 10,000 | Balkans |
| I2b1 | 9,000 | Central Europe |
| I2a1 | 8,000 | Pyrenees |
| I2a2 | 7,500 | Dinaric Alps |
| E1b1b-M81 | 5,500 | Maghreb |
| I1 | 5,000 | Scandinavia |
| R1b-L21 | 4,000 | Central or Eastern Europe |
| R1b-S28 | 3,500 | around the Alps |
| R1b-S21 | 3,000 | Frisia or Central Europe |
| I2b1a | < 3,000 | Britain |
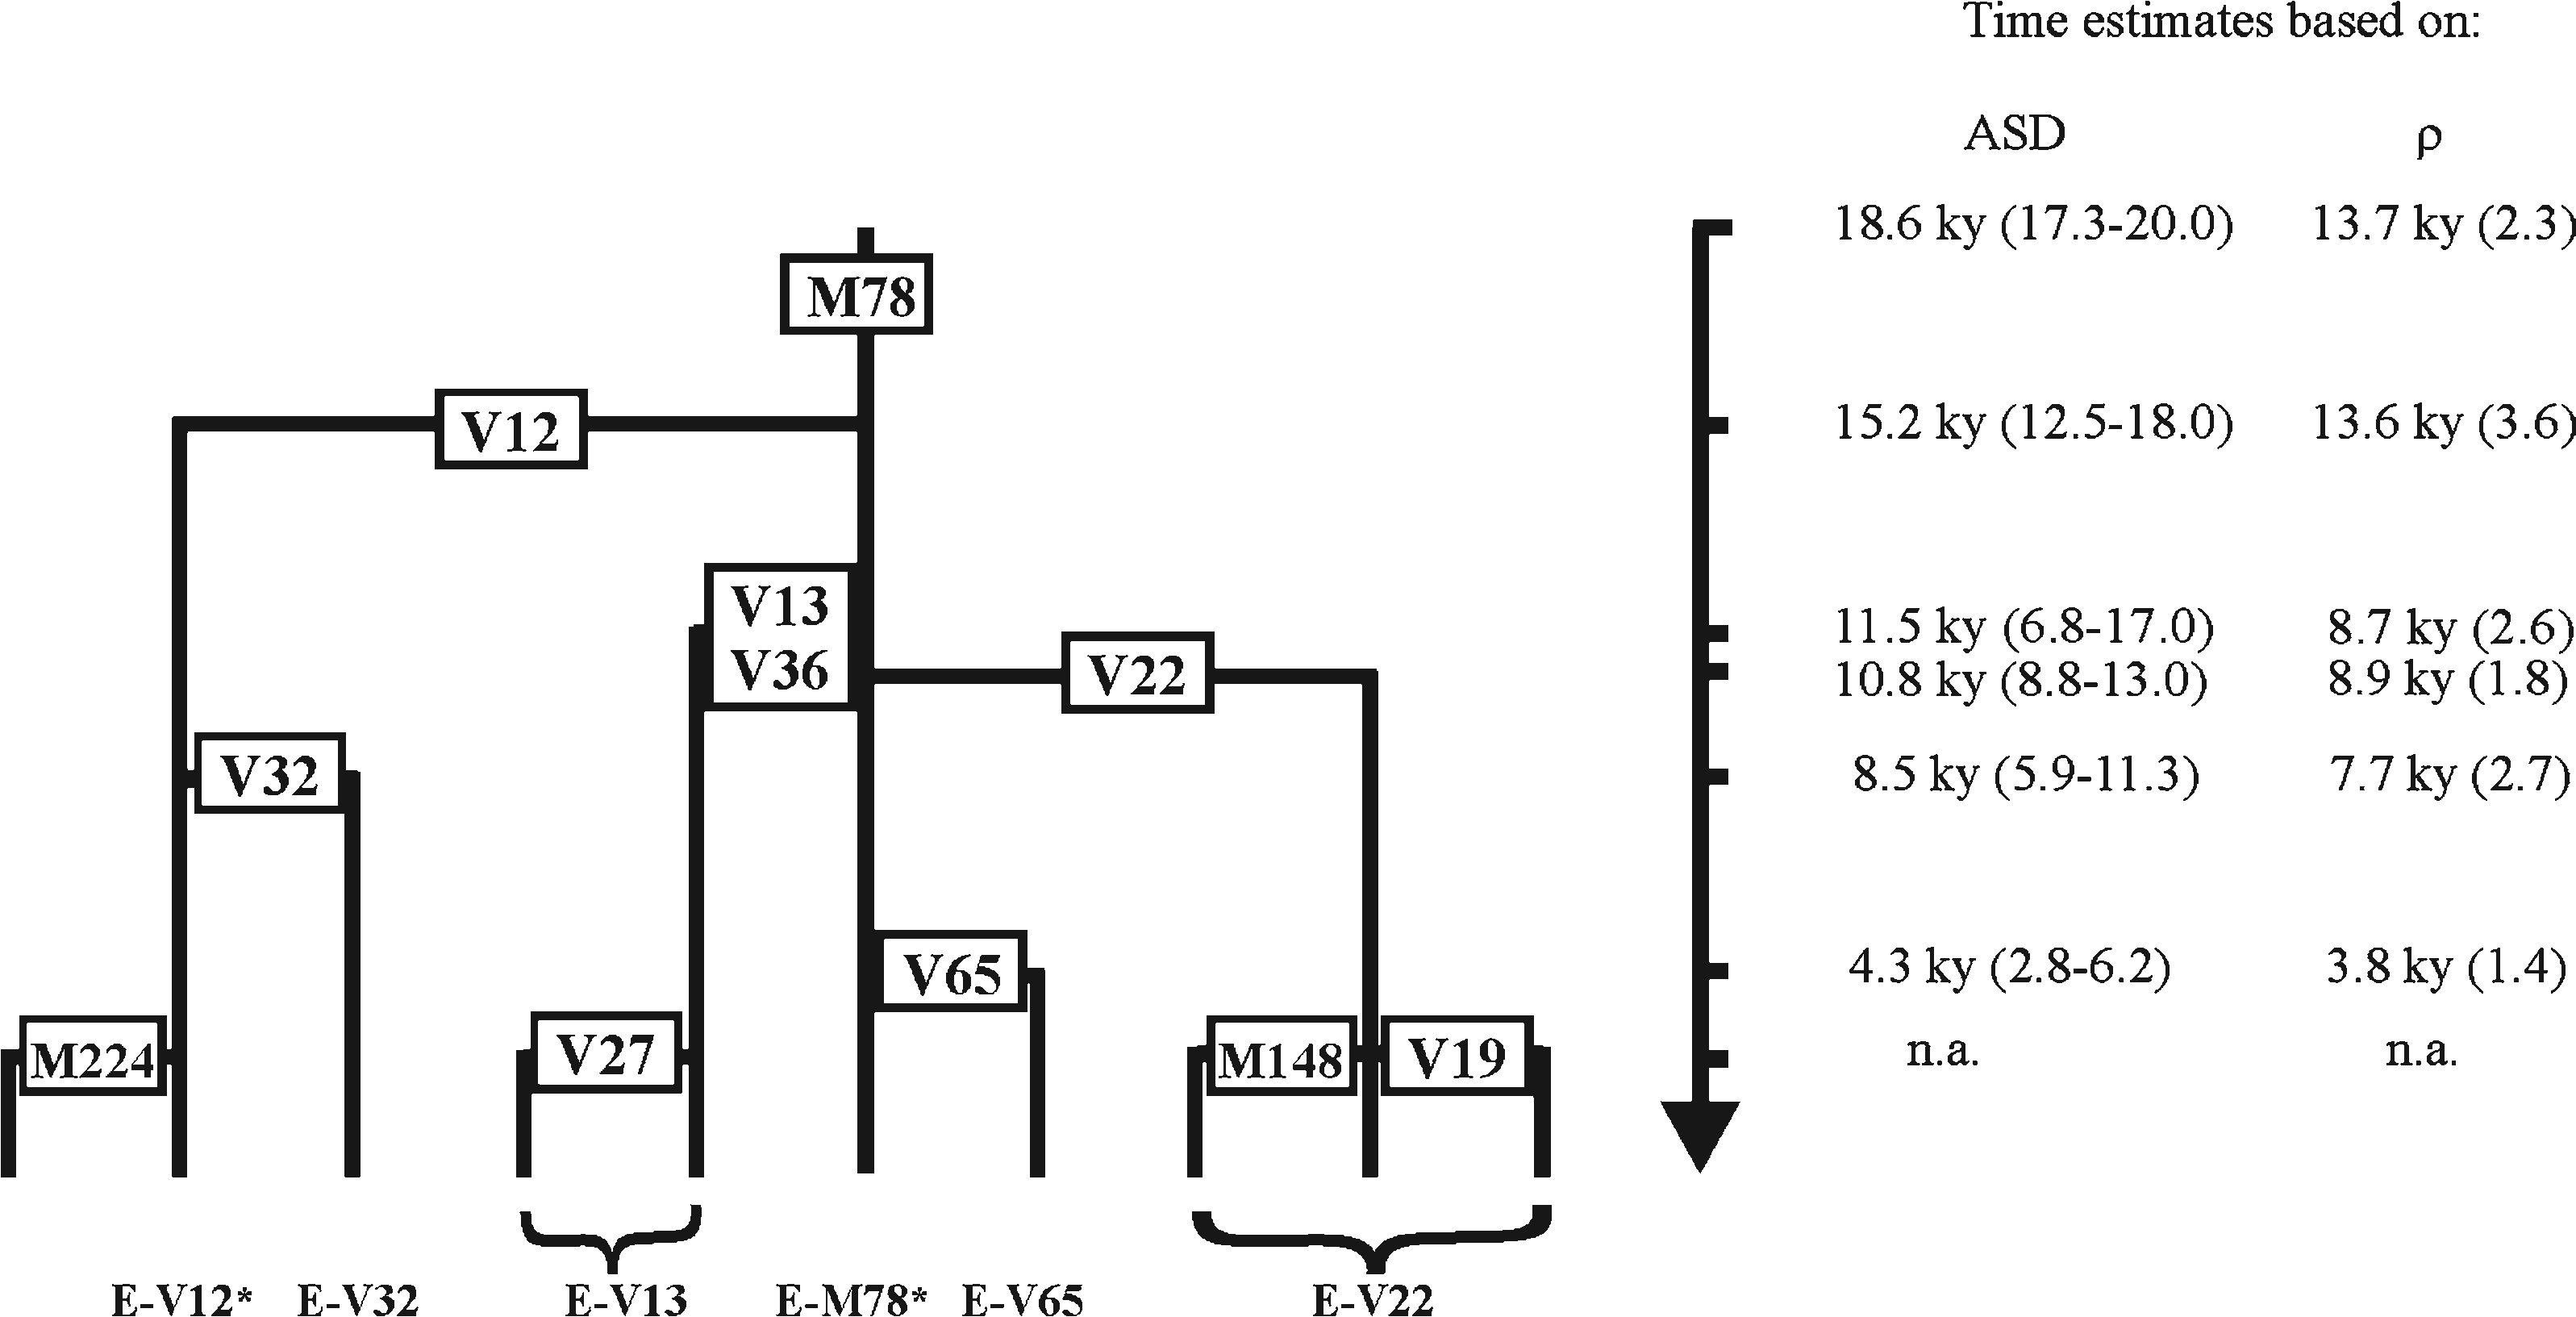
Ages of E: M78, V12, V32, M224, V13, V36, V27, V65, V22, M148, V19
Источник: Tracing Past Human Male Movements in Northern/Eastern Africa and Western Eurasia: New Clues from Y-Chromosomal Haplogroups E-M78 and J-M12. Cruciani 2007
Источник: Tracing Past Human Male Movements in Northern/Eastern Africa and Western Eurasia: New Clues from Y-Chromosomal Haplogroups E-M78 and J-M12. Cruciani 2007
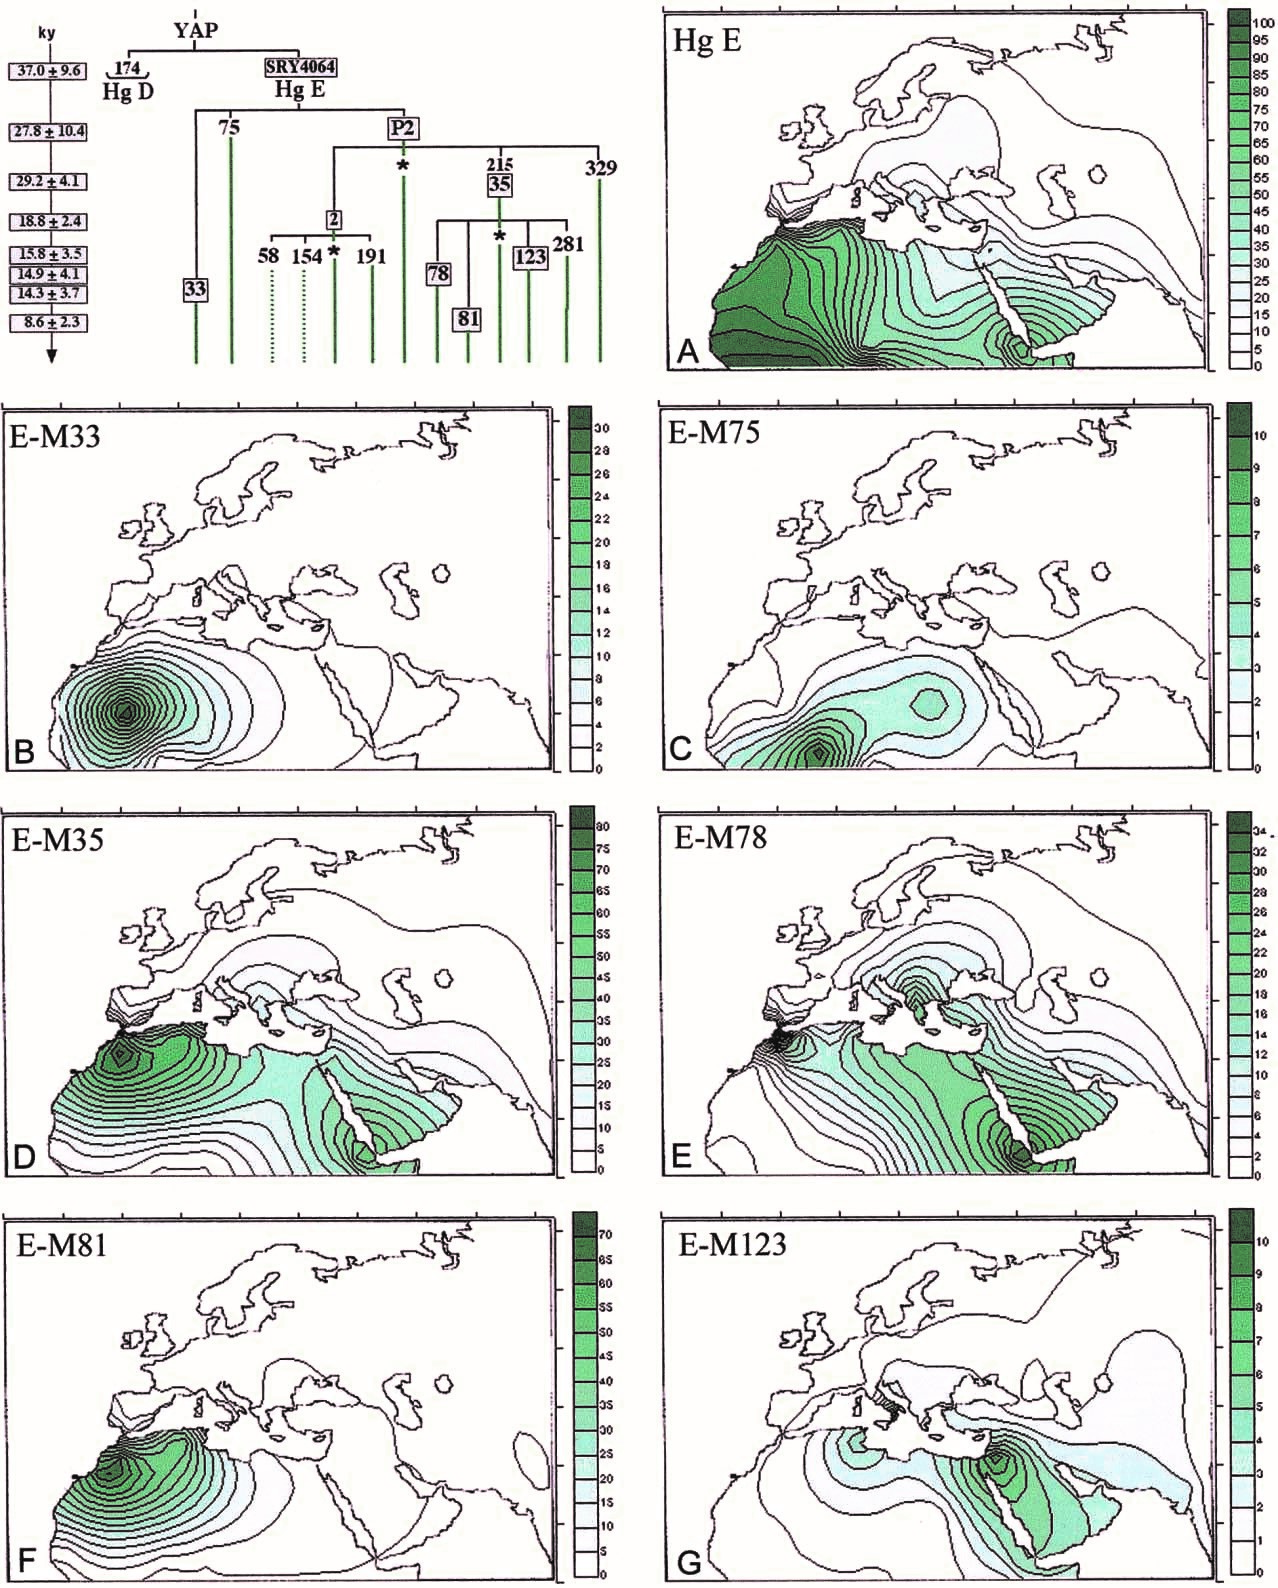
Ages of E: M33, M75, M35, M78, M81, M123
Источник: Origin, Diffusion, and Differentiation of Y-Chromosome Haplogroups E and J: Inferences on the Neolithization of Europe and Later Migratory Events in the Mediterranean Area. Semino 2004
Источник: Origin, Diffusion, and Differentiation of Y-Chromosome Haplogroups E and J: Inferences on the Neolithization of Europe and Later Migratory Events in the Mediterranean Area. Semino 2004
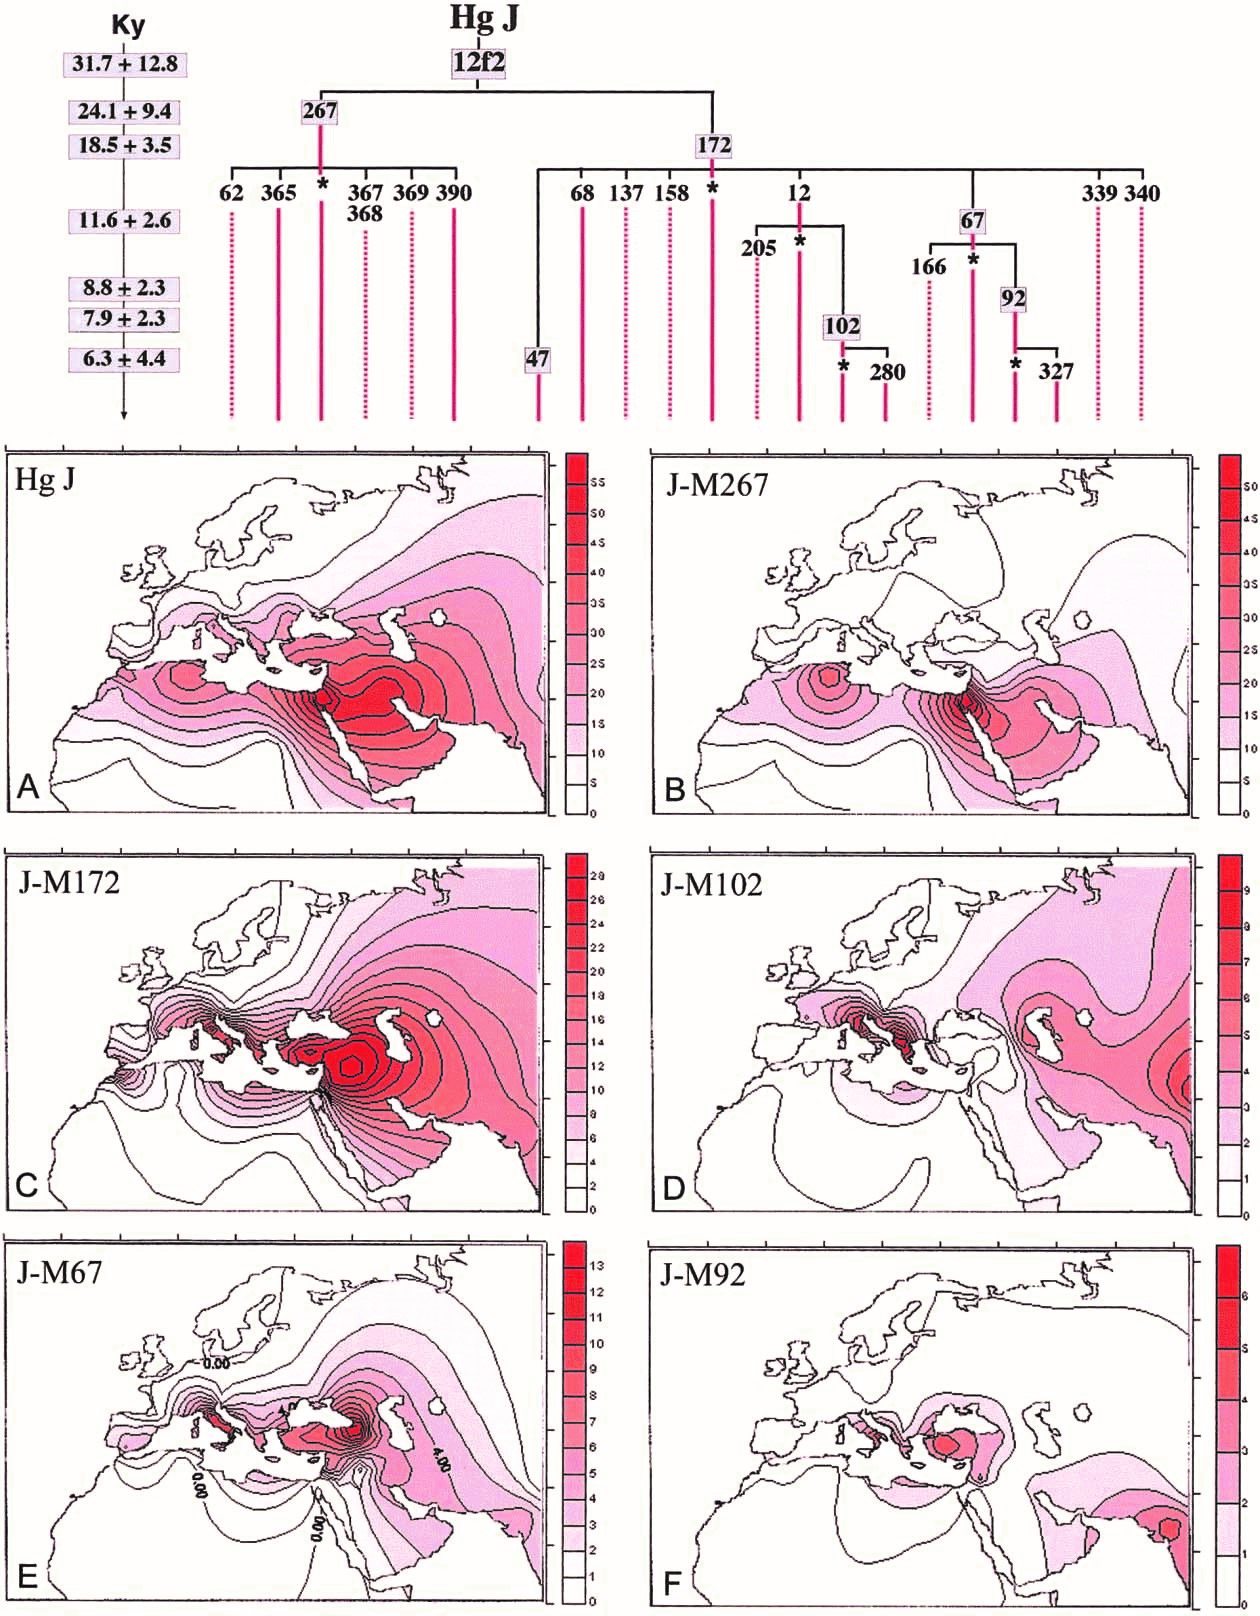
Ages of J: M267, M172, M102, M67, M92
Источник: Origin, Diffusion, and Differentiation of Y-Chromosome Haplogroups E and J: Inferences on the Neolithization of Europe and Later Migratory Events in the Mediterranean Area. Semino 2004
Источник: Origin, Diffusion, and Differentiation of Y-Chromosome Haplogroups E and J: Inferences on the Neolithization of Europe and Later Migratory Events in the Mediterranean Area. Semino 2004
Age Estimates and Divergence Times of Haplogroup I Subclades
Источник: Phylogeography of Y-Chromosome Haplogroup I Reveals Distinct Domains of Prehistoric Gene Flow in Europe. Rootsi 2004
Источник: Phylogeography of Y-Chromosome Haplogroup I Reveals Distinct Domains of Prehistoric Gene Flow in Europe. Rootsi 2004
AGE ESTIMATE OR DIVERGENCE TIME		  HAPLOGROUP I SUBCLADE
                 	                      I*	     I1a	    I1b*	   I1b2		   I1c
Time since subclade divergence [a]	      …	        15.9 ± 5.2[b]	10.7 ± 4.8[b]	9.3 ± 7.6c	14.6 ± 3.8[b]
Age of STR variation [d]	                 24.0 ± 7.1	8.8 ± 3.2	7.6 ± 2.7	8.0 ± 4.0	13.2 ± 2.7
Time since population divergence [e]	 23.0 ± 7.7[f]	6.8 ± 1.9[g]	7.1 ± 2.5	7.9 ± 3.6[h]	11.2 ± 2.3[i]


[a] The times, in thousands of years, when the subclades I1a, I1b*, and I1c diverged from I*, as well as when I1b2
diverged from I1b*, were estimated by using the TD estimator: TD p (D1  2V0)/2w (Zhivotovsky et al. 2001, 2004).
Here, D1 is the average squared difference between two alleles sampled from two populations; V0 is the
within-population variance in the number of repeats in the ancestral population prior to its subdivision, estimated
as a half square difference between the allele repeat scores at the founder haplotypes; and w is the effective
mutation rate of 0.00069 per locus per 25 years (Zhivotovsky et al. 2004).
[b] Divergence from I*.
[c] Divergence from I1b*.
[d] The age of STR variation of a subclade was estimated as the average squared difference in the number of repeats
between all sampled chromosomes and the founder haplotype, divided by w. Ages of STR variation within clades I and
I1b were estimated by using I* and I1b* Y chromosomes, respectively. This makes them statistically independent from
the STR variation of their subclades, although they could be still biased because of uncertainties
on founder haplotypes.
[e] The age of population expansion (divergence), estimated with TD, letting V0 p 0, gives its upper bound.
Time since population divergence was analyzed only in populations with a sample size of at least five
individuals; the estimates give an upper bound for the time of population expansion (divergence).
[f] Since all populations, except the Turks, were represented within I* by fewer than five individuals each, only
two samples were compared: Turks versus “Others.”
[g] Obtained by comparing Croat, Czech, Estonian, French, Hungarian, Norwegian, Saami, Swedish, Swiss, Turkish,
and Ukrainian populations.
[h] Since all populations, except the Sardinians, were represented within I1b2 by fewer than five individuals
each, only two samples were compared: Sardinians versus “Others.”
[i] Because of the small sample size for each separate population, we used five combined samples—namely,
southern European (Albanian, Calabrian, central Italian, Sardinian, southern French), northern European
(Norwegian, Swedish, Estonian, Dutch), eastern/central European (Hungarian, Croat, Czech, Slovakian),
western/central European (French–Low Normandy, French-Lyon, northern Italian, Swiss), and southern/eastern
European (Gagauz, Turkish, Ukrainian).
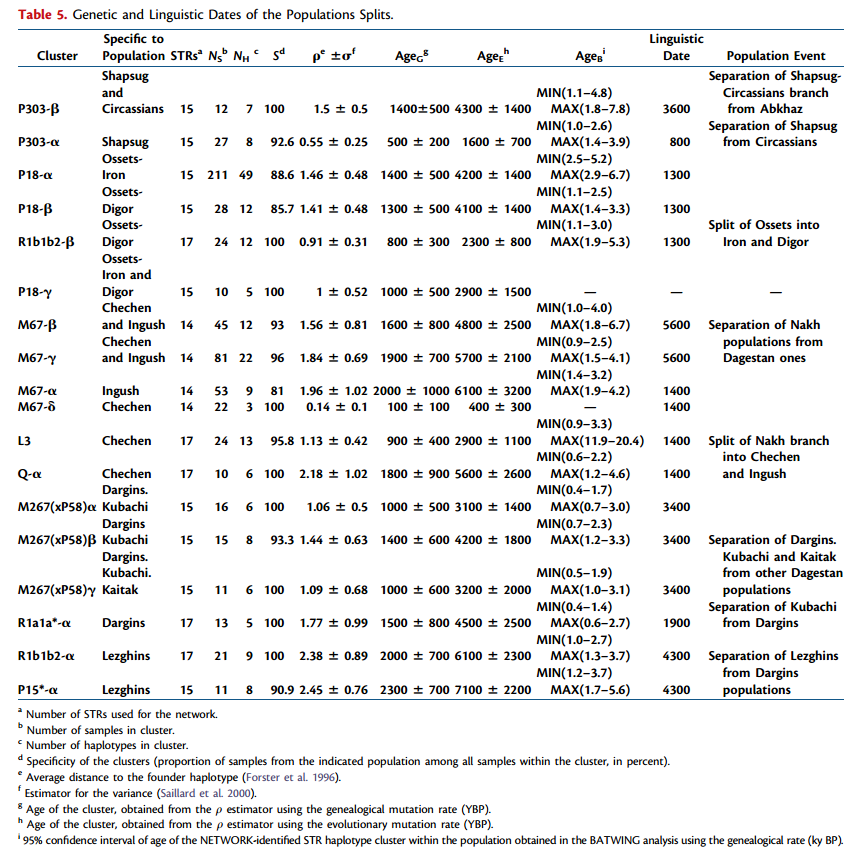
Ages of P303-β, P303-α, P18-α, P18-β, R1b1b2-β, P18-γ, M67-β, M67-γ, M67-α, M67-δ, L3, Q-α, M267(xP58)α, M267(xP58)β, M267(xP58)γ, R1a1a*-α, R1b1b2-α, P15*-α
Источник: Parallel Evolution of Genes and Languages in the Caucasus Region. Balanovsky 2011
Источник: Parallel Evolution of Genes and Languages in the Caucasus Region. Balanovsky 2011
Ages of of haplogroup G and subclades
Источник: Distinguishing the co-ancestries of haplogroup G Y-chromosomes in the populations of Europe and the Caucasus. Rootsi 2012
Источник: Distinguishing the co-ancestries of haplogroup G Y-chromosomes in the populations of Europe and the Caucasus. Rootsi 2012
| Median haplotypes by population | Era | ||||||||||||||
| G | Population | N | TD | SE | D19 | D388 | D389I | D389b | D390 | D391 | D392 | D393 | D439 | A7.2 | |
| M285 | Caucasus | 11 | 15,810 | 4,653 | 16 | 12 | 13 | 17 | 23 | 10 | 12 | 13 | 12 | 11 | |
| Total | 28 | 19,975 | 5,642 | 14,5 | 12 | 12 | 16 | 23 | 10 | 12 | 13 | 11 | 11 | LGM1 Refugia | |
| M285* | Caucasus | 8 | 14,040 | 3,601 | 16 | 12 | 13 | 16,5 | 23 | 10 | 12 | 13 | 12 | 11 | |
| Total | 20 | 20,265 | 6,342 | 15 | 12 | 12 | 16 | 23 | 10 | 12 | 13 | 11 | 11 | ||
| P20 | Total | 8 | 15,851 | 6,624 | 14 | 12 | 12 | 16 | 23,5 | 10 | 12 | 13 | 11 | 12 | Epipaleolithic Expansion |
| P287 | Balkan | 12 | 15,783 | 2,170 | 15 | 13 | 12 | 17 | 22 | 10 | 11 | 14 | 12 | 10 | |
| Caucasus | 215 | 14,049 | 2,450 | 15 | 12 | 12 | 17 | 22 | 10 | 11 | 14 | 11 | 11 | ||
| Crete | 5 | 6,522 | 3,140 | 15 | 12 | 12 | 17 | 22 | 10 | 11 | 14 | 11 | 10 | ||
| Corsica | 71 | 14,619 | 2,219 | 15 | 12 | 13 | 17 | 22 | 11 | 11 | 14 | 12 | 11 | ||
| Druze | 35 | 4,765 | 1,922 | 15 | 12 | 12 | 17 | 22 | 11 | 11 | 13 | 12 | 10 | ||
| Eastern Europe | 42 | 13,278 | 1,834 | 15 | 12 | 12 | 17 | 22 | 10 | 11 | 14 | 11 | 10 | ||
| Germany | 15 | 13,147 | 2,293 | 15 | 13 | 12 | 17 | 22 | 10 | 11 | 14 | 11 | 10 | ||
| Greece | 10 | 11,594 | 2,743 | 15 | 12 | 12 | 17 | 22 | 10 | 11 | 14 | 11 | 10 | ||
| Iran | 28 | 12,434 | 2,282 | 15 | 12 | 12 | 17 | 22 | 10 | 11 | 14 | 12 | 10 | ||
| Italy | 25 | 12,899 | 3,446 | 15 | 12 | 12 | 17 | 22 | 10 | 11 | 14 | 11 | 10 | ||
| Ashkenazi Jews | 39 | 2,994 | 1,081 | 15 | 12 | 14 | 18 | 23 | 10 | 11 | 13 | 11 | na | ||
| Sephardic Jews | 23 | 14,585 | 3,015 | 15 | 12 | 12 | 17 | 22 | 10 | 11 | 14 | 11 | 10 | ||
| Pakistan | 10 | 15,761 | 5,146 | 16 | 12 | 12 | 16,5 | 23 | 10 | 11 | 13,5 | 11 | 10,5 | ||
| Palestine | 19 | 5,191 | 1,783 | 15 | 12 | 12 | 17 | 22 | 11 | 11 | 14 | 12 | 10 | ||
| Russia | 5 | 16,667 | 5,721 | 15 | 12 | 12 | 17 | 23 | 10 | 11 | 14 | 11 | 11 | ||
| Switzerland | 14 | 14,134 | 2,937 | 15 | 13 | 12 | 17 | 22 | 10 | 11 | 14 | 11 | 10 | ||
| Turkey | 59 | 16,089 | 2,848 | 15 | 12 | 12 | 17 | 22 | 10 | 11 | 14 | 11 | 10 | ||
| Afghanistan | 12 | 2,114 | 1,277 | 16 | 12 | 13 | 17 | 23 | 11 | 11 | 13 | 11 | 11 | ||
| Total | 674 | 16,356 | 2,264 | 15 | 12 | 12 | 17 | 22 | 10 | 11 | 14 | 11 | 11 | LGM Refugia-Turkey/Pakistan/?Caspian Expansion | |
| P15 | Balkan | 12 | 15,783 | 2,170 | 15 | 13 | 12 | 17 | 22 | 10 | 11 | 14 | 12 | 10 | |
| Caucasus | 215 | 14,049 | 2,450 | 15 | 12 | 12 | 17 | 22 | 10 | 11 | 14 | 11 | 11 | ||
| Crete | 5 | 6,522 | 3,140 | 15 | 12 | 12 | 17 | 22 | 10 | 11 | 14 | 11 | 10 | ||
| Corsica | 71 | 14,619 | 2,219 | 15 | 12 | 13 | 17 | 22 | 11 | 11 | 14 | 12 | 11 | ||
| Druze | 35 | 4,765 | 1,922 | 15 | 12 | 12 | 17 | 22 | 11 | 11 | 13 | 12 | 10 | ||
| Eastern Europe | 41 | 12,956 | 1,732 | 15 | 12 | 12 | 17 | 22 | 10 | 11 | 14 | 11 | 10 | ||
| Germany | 15 | 13,147 | 2,293 | 15 | 13 | 12 | 17 | 22 | 10 | 11 | 14 | 11 | 10 | ||
| Greece | 10 | 11,594 | 2,743 | 15 | 12 | 12 | 17 | 22 | 10 | 11 | 14 | 11 | 10 | ||
| Iran | 28 | 12,434 | 2,282 | 15 | 12 | 12 | 17 | 22 | 10 | 11 | 14 | 12 | 10 | ||
| Italy | 25 | 12,899 | 3,446 | 15 | 12 | 12 | 17 | 22 | 10 | 11 | 14 | 11 | 10 | ||
| Ashkenazi Jews | 9 | 6,710 | 2,511 | 15 | 12 | 14 | 18 | 23 | 10 | 11 | 13 | 11 | na | ||
| Sephardic Jews | 23 | 14,585 | 3,015 | 15 | 12 | 12 | 17 | 22 | 10 | 11 | 14 | 11 | 10 | ||
| Pakistan | 10 | 15,761 | 5,146 | 16 | 12 | 12 | 16,5 | 23 | 10 | 11 | 13,5 | 11 | 10,5 | ||
| Palestine | 19 | 5,191 | 1,783 | 15 | 12 | 12 | 17 | 22 | 11 | 11 | 14 | 12 | 10 | ||
| Russia | 5 | 16,667 | 5,721 | 15 | 12 | 12 | 17 | 23 | 10 | 11 | 14 | 11 | 11 | ||
| Switzerland | 12 | 9,223 | 2,329 | 15 | 13 | 12 | 17 | 22 | 10 | 11 | 14 | 11 | 10 | ||
| Turkey | 58 | 15,992 | 2,861 | 15 | 12 | 12 | 17 | 22 | 10 | 11 | 14 | 11 | 10 | ||
| Total | 628 | 15,983 | 2,219 | 15 | 12 | 12 | 17 | 22 | 10 | 11 | 14 | 11 | 10 | LGM Refugia-Turkey/Pakistan/?Caspian Expansion | |
| P15* | Caucasus | 5 | 16,848 | 3,542 | 15 | 12 | 12 | 17 | 23 | 10 | 11 | 14 | 11 | 11 | |
| Corsica | 5 | 6,441 | 3,066 | na | 13 | 13 | 17 | 23 | 10 | 11 | 13 | 12 | 11 | ||
| Eastern Europe | 5 | 9,903 | 3,065 | 15 | 13 | 13 | 16 | 22 | 10 | 11 | 13 | 11 | 11 | ||
| Turkey | 8 | 10,417 | 2,031 | 15 | 13 | 13 | 17 | 22 | 10 | 11 | 13 | 11 | 11 | ||
| Total | 38 | 15,487 | 2,426 | 15 | 12,5 | 13 | 17 | 22 | 10 | 11 | 13 | 11 | 11 | ||
| L91 | Corsica | 37 | 6,528 | 2,171 | na | 12 | 14 | 16 | 22 | 11 | 11 | 14 | 12 | 11 | Late Neolithic Expansion to Corsica |
| Total | 48 | 10,903 | 2,523 | na | 12 | 14 | 16 | 22 | 11 | 11 | 14 | 12 | 11 | Mesolithic Expansion to Central Mediterranean | |
| P16 | Caucasus | 97 | 9,609 | 2,411 | 15 | 12 | 12 | 17 | 22 | 10 | 10 | 14 | 11 | 11 | |
| Eastern Europe | 5 | 7,246 | 2,646 | 15 | 12 | 12 | 17 | 22 | 10 | 10 | 14 | 11 | 11 | ||
| Turkey | 9 | 7,649 | 1,940 | 15 | 12 | 12 | 17 | 22 | 10 | 10 | 14 | 12 | 11 | ||
| Total | 120 | 9,519 | 2,130 | 15 | 12 | 12 | 17 | 22 | 10 | 10 | 14 | 12 | 11 | Mesolithic Expansion in Caucasus | |
| M485 | Balkan | 8 | 8,152 | 1,886 | 15 | 13 | 12 | 17 | 22 | 10 | 11 | 13,5 | 12 | 10 | |
| Caucasus | 111 | 13,130 | 3,830 | 15 | 12 | 12 | 17 | 23 | 10 | 11 | 14 | 11 | 11 | ||
| Crete | 5 | 6,522 | 3,140 | 15 | 12 | 12 | 17 | 22 | 10 | 11 | 14 | 11 | 10 | ||
| Corsica | 26 | 9,582 | 1,858 | 15 | 13 | 12 | 17 | 22 | 10 | 11 | 14 | 11 | 10 | ||
| Druze | 34 | 4,049 | 1,831 | 15 | 12 | 12 | 17 | 22 | 11 | 11 | 13 | 12 | 10 | ||
| Eastern Europe | 30 | 10,386 | 1,949 | 15 | 12 | 12 | 17 | 22 | 10 | 11 | 14 | 11 | 10 | ||
| Germany | 14 | 11,905 | 2,536 | 15 | 13 | 12 | 17 | 22 | 10 | 11 | 14 | 11 | 10 | ||
| Greece | 9 | 12,077 | 2,940 | 15 | 12 | 12 | 17 | 22 | 10 | 11 | 14 | 11 | 10 | ||
| Iran | 20 | 8,696 | 2,336 | 15 | 12 | 12 | 16,5 | 22 | 10 | 11 | 14 | 12 | 10 | ||
| Italy | 23 | 11,972 | 3,213 | 15 | 12 | 12 | 17 | 22 | 10 | 11 | 14 | 11 | 10 | ||
| Sephardic Jews | 17 | 8,325 | 2,297 | 15 | 12 | 12 | 17 | 22 | 10 | 11 | 14 | 11 | 10 | ||
| Pakistan | 6 | 10,870 | 4,746 | 16 | 12 | 12 | 16 | 23 | 10 | 11 | 14 | 11 | 9 | ||
| Palestine | 19 | 5,191 | 1,783 | 15 | 12 | 12 | 17 | 22 | 11 | 11 | 14 | 12 | 10 | ||
| Switzerland | 12 | 9,223 | 2,329 | 15 | 13 | 12 | 17 | 22 | 10 | 11 | 14 | 11 | 10 | ||
| Turkey | 40 | 15,580 | 4,414 | 15 | 12 | 12 | 16 | 21 | 10 | 11 | 14 | 11 | 10 | ||
| Total | 404 | 12,698 | 2,201 | 15 | 12 | 12 | 17 | 22 | 10 | 11 | 14 | 11 | 10 | Post-LGM expansion in Turkey to Mesolithic in Europe | |
| M485* | Total | 11 | 10,540 | 3,098 | 15 | 12 | 12 | 17 | 22 | 10 | 11 | 14 | 11 | 10 | |
| P303 | Balkan | 7 | 7,246 | 1,921 | 15 | 13 | 12 | 17 | 22 | 10 | 11 | 14 | 12 | 10 | |
| Caucasus | 94 | 10,650 | 3,177 | 15 | 12 | 12 | 17 | 23 | 10 | 11 | 14 | 11 | 11 | ||
| Crete | 5 | 6,522 | 3,140 | 15 | 12 | 12 | 17 | 22 | 10 | 11 | 14 | 11 | 10 | ||
| Corsica | 25 | 9,529 | 1,808 | 15 | 13 | 12 | 17 | 22 | 10 | 11 | 14 | 11 | 10 | ||
| Druze | 9 | 4,831 | 2,460 | 15 | 12 | 13 | 16 | 22 | 11 | 11 | 13 | 12 | 10 | ||
| Eastern Europe | 24 | 10,568 | 2,013 | 15 | 12 | 12 | 17 | 22 | 10 | 11 | 14 | 11 | 10 | ||
| Germany | 12 | 11,775 | 2,564 | 15 | 13 | 12 | 17 | 22 | 10 | 11 | 14 | 11 | 10 | ||
| Greece | 6 | 9,058 | 3,246 | 15 | 12 | 12 | 17 | 22,5 | 10 | 11 | 14 | 12 | 10,5 | ||
| Iran | 13 | 6,689 | 2,568 | 15 | 12 | 12 | 16 | 22 | 10 | 11 | 14 | 12 | 10 | ||
| Italy | 14 | 9,576 | 2,043 | 15 | 13 | 12 | 17 | 22 | 10 | 11 | 14 | 12 | 10 | ||
| Pakistan | 5 | 14,493 | 7,001 | 16 | 12 | 12 | 16 | 23 | 10 | 11 | 14 | 11 | 9 | ||
| Turkey | 15 | 10,386 | 3,056 | 15 | 12 | 12 | 17 | 22 | 10 | 11 | 14 | 11 | 11 | ||
| Switzerland | 10 | 6,240 | 2,483 | 15 | 13 | 12 | 17 | 22 | 10 | 11 | 14 | 11 | 10 | ||
| Total | 301 | 12,545 | 2,269 | 15 | 12 | 12 | 17 | 22 | 10 | 11 | 14 | 11 | 10 | ||
| P303* | Caucasus | 13 | 13,099 | 4,495 | 15 | 12 | 12 | 17 | 22 | 10 | 11 | 14 | 12 | 10 | |
| Corsica | 7 | 10,352 | 3,619 | 15 | 12 | 12 | 17 | 22 | 11 | 11 | 13 | 11 | 10 | ||
| Druze | 6 | 0,604 | 0,604 | 15 | 12 | 13 | 16 | 22 | 11 | 11 | 13 | 12 | 10 | ||
| Eastern Europe | 7 | 12,422 | 3,635 | 15 | 12 | 12 | 17 | 22 | 10 | 11 | 14 | 11 | 10 | ||
| Iran | 5 | 7,971 | 3,655 | 15 | 12 | 12 | 16 | 23 | 10 | 11 | 14 | 12 | 10 | ||
| Sephardic Jews | 11 | 7,576 | 2,646 | 15 | 12 | 12 | 16 | 22 | 10 | 11 | 14 | 11 | 10 | ||
| Turkey | 9 | 8,857 | 3,833 | 15 | 12 | 12 | 17 | 22 | 10 | 11 | 14 | 11 | 11 | ||
| Total | 77 | 12,133 | 2,748 | 15 | 12 | 12 | 17 | 22 | 10 | 11 | 14 | 11 | 10 | ||
| L497 | Balkan | 7 | 7,246 | 1,921 | 15 | 13 | 12 | 17 | 22 | 10 | 11 | 14 | 12 | 10 | |
| Corsica | 17 | 6,674 | 2,073 | 15 | 13 | 12 | 17 | 22 | 10 | 11 | 14 | 11 | 10 | ||
| Eastern Europe | 5 | 5,797 | 1,808 | 15 | 13 | 12 | 17 | 22 | 10 | 11 | 14 | 11 | 10 | ||
| Germany | 11 | 10,870 | 3,029 | 15 | 13 | 12 | 17 | 22 | 10 | 11 | 14 | 11 | 10 | ||
| Italy | 8 | 6,341 | 2,259 | 15 | 13 | 12 | 17 | 22 | 10 | 11 | 14 | 11,5 | 10 | ||
| Switzerland | 8 | 4,658 | 1,698 | 15 | 13 | 12 | 17 | 22 | 10 | 11 | 14 | 11 | 10 | ||
| Total | 63 | 7,493 | 1,555 | 15 | 13 | 12 | 17 | 22 | 10 | 11 | 14 | 11 | 10 | Expansion in Europe during initial Neolithic eg LBK | |
| U1* | Caucasus | 86 | 10,195 | 3,148 | 15 | 12 | 12 | 17 | 23 | 10 | 11 | 14 | 11 | 11 | |
| Eastern Europe | 8 | 5,435 | 1,761 | 15 | 12 | 12 | 17 | 23 | 10 | 11 | 14 | 11 | 10 | ||
| Palestine | 13 | 3,066 | 1,406 | 15 | 12 | 12 | 17 | 22 | 11 | 11 | 14 | 12 | 10 | ||
| Turkey | 8 | 7,699 | 2,531 | 15 | 12 | 12 | 17 | 22,5 | 10 | 11 | 14 | 11 | 10,5 | ||
| Total | 125 | 10,580 | 2,856 | 15 | 12 | 12 | 17 | 23 | 10 | 11 | 14 | 11 | 11 | Mesolithic Expansion in Caucasus | |
| M527 | Iran | 6 | 4,831 | 2,514 | 15 | 12 | 12 | 16 | 22 | 10 | 11 | 14 | 12 | 10 | |
| Total | 33 | 7,246 | 2,373 | 15 | 12 | 12 | 17 | 22 | 10 | 11 | 14 | 12 | 10 | Aegean Early Neolithic Expansion | |
| M406 | Caucasus | 17 | 9,165 | 3,194 | 16 | 12 | 12 | 16 | 21 | 10 | 11 | 14 | 11 | 10 | |
| Druze | 25 | 1,884 | 1,434 | 15 | 12 | 12 | 17 | 22 | 11 | 11 | 13 | 11 | 10 | ||
| Iran | 7 | 8,799 | 1,898 | 15 | 12 | 12 | 17 | 21 | 10 | 11 | 14 | 11 | 10 | ||
| Italy | 9 | 8,052 | 2,546 | 15 | 12 | 12 | 17 | 21 | 10 | 11 | 14 | 11 | 10 | ||
| Turkey | 23 | 12,760 | 4,844 | 15 | 12 | 12 | 16 | 21 | 10 | 11 | 14 | 11 | 10 | ||
| Total | 103 | 11,971 | 2,579 | 15 | 12 | 12 | 17 | 21 | 10 | 11 | 14 | 11 | 10 | Epipaleolithic Expansion in Turkey to Early Neolithic in Italy | |
| M406* | Caucasus | 11 | 10,211 | 4,062 | 16 | 12 | 12 | 17 | 21 | 10 | 11 | 14 | 11 | 10 | |
| Druze | 25 | 1,884 | 1,434 | 15 | 12 | 12 | 17 | 22 | 11 | 11 | 13 | 11 | 10 | ||
| Iran | 6 | 8,152 | 1,562 | 15 | 12 | 12 | 17 | 21 | 10 | 11 | 14,5 | 11 | 10 | ||
| Italy | 7 | 8,799 | 2,787 | 15 | 12 | 12 | 17 | 21 | 10 | 11 | 14 | 11 | 10 | ||
| Turkey | 14 | 10,870 | 3,854 | 15 | 12 | 12 | 16 | 21 | 10 | 11 | 15 | 12 | 10 | ||
| Total | 81 | 12,356 | 3,192 | 15 | 12 | 12 | 17 | 21 | 10 | 11 | 14 | 11 | 10 | ||
| Page19 | Caucasus | 6 | 4,227 | 2,390 | 16 | 12 | 12 | 16 | 21 | 10 | 11 | 14 | 11 | 10 | |
| Turkey | 9 | 7,649 | 3,956 | 15 | 12 | 12 | 16 | 21 | 10 | 11 | 14 | 11 | 10 | ||
| Total | 22 | 6,917 | 2,525 | 16 | 12 | 12 | 16 | 21 | 10 | 11 | 14 | 11 | 10 | ||
| M377 | Ashkenazi Jews | 38 | 2,013 | 0,919 | 15 | 12 | 14 | 18 | 23 | 10 | 11 | 13 | 11 | na | |
| Afghanistan | 12 | 2,114 | 1,277 | 16 | 12 | 13 | 17 | 23 | 11 | 11 | 13 | 11 | 11 | ||
| Total | 60 | 5,625 | 2,166 | 15 | 12 | 14 | 18 | 23 | 10 | 11 | 13 | 11 | 11 | Early Bronze Age Expansion | |
| na - DYS 19 locus is excluded from analysis because of duplication (Capelli et al. 2007) | |||||||||||||||
| LGM1 - Last Glacial Maximum | |||||||||||||||
Egypt and Oman Y Chromosome Haplogroup Variance and Expansion Times Based on 10 STR Loci. E3b-M35, E3b1-M78, E3b2-M81, E3b3-M123, G-M201, J-12f2, J*-12f2d, J2-M172, K2-M70, E3b3-M123, R1a1-M17
Источник: The Levant versus the Horn of Africa: Evidence for Bidirectional Corridors of Human Migrations. Luis 2004
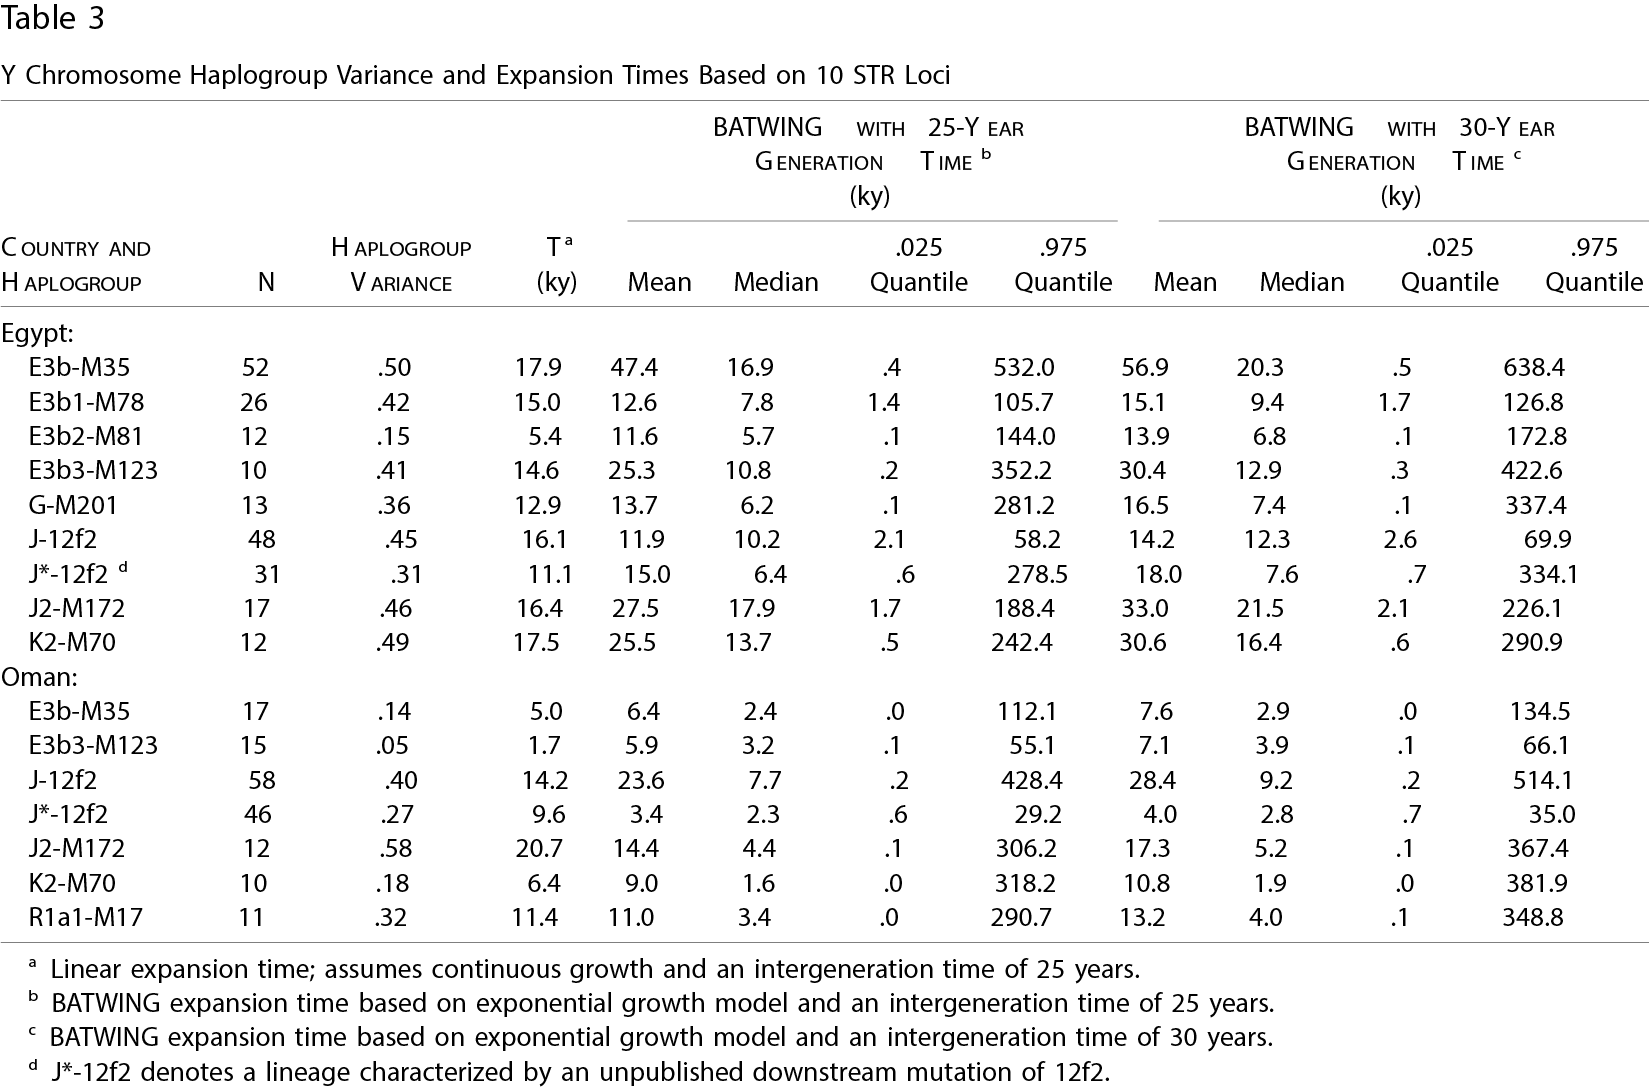
Источник: The Levant versus the Horn of Africa: Evidence for Bidirectional Corridors of Human Migrations. Luis 2004
Y IN CZECHS. I-M170, I1-M2531, I2a-P371, I2b1-M2231, P-DYS257*(xR1a), R1a-SRY10831
Источник: Y-Chromosomal Variation in the Czech Republic. Luca 2006
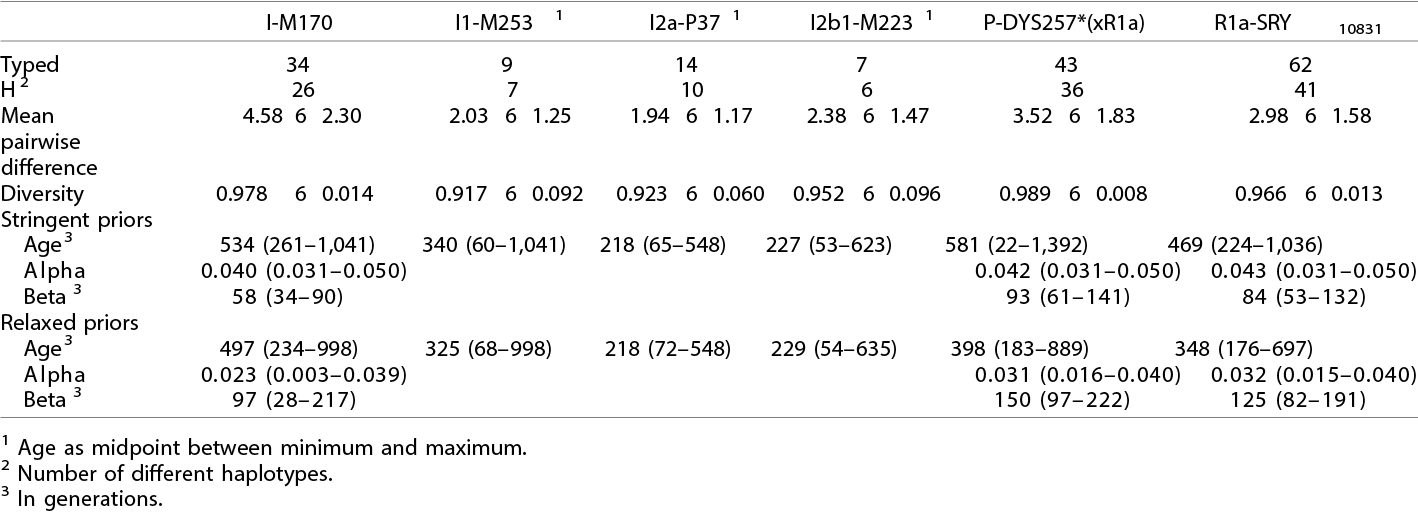
Источник: Y-Chromosomal Variation in the Czech Republic. Luca 2006
TMRCA of 11 major clades on the Y chromosome haplogroup tree. CT, CF, DE, E, E1b1, F, IJ, I, K, P, R, R1
Источник: New binary polymorphisms reshape and increase resolution of the human Y chromosomal haplogroup tree. Karafet 2008

Источник: New binary polymorphisms reshape and increase resolution of the human Y chromosomal haplogroup tree. Karafet 2008
Estimates of age of haplogroup J, J sub-haplogroups
Источник: Y chromosomal haplogroup J as a signature of the post-neolithic colonization of Europe. Giacomo 2004

Источник: Y chromosomal haplogroup J as a signature of the post-neolithic colonization of Europe. Giacomo 2004
Caucasian ages of G2a3b1-P303, G2a1a-P18, J2a4b*-M67(xM92), J1*-M267(xP58)
Источник: Balanovsky 2011. Supplementary Table 1. Лист Table S3
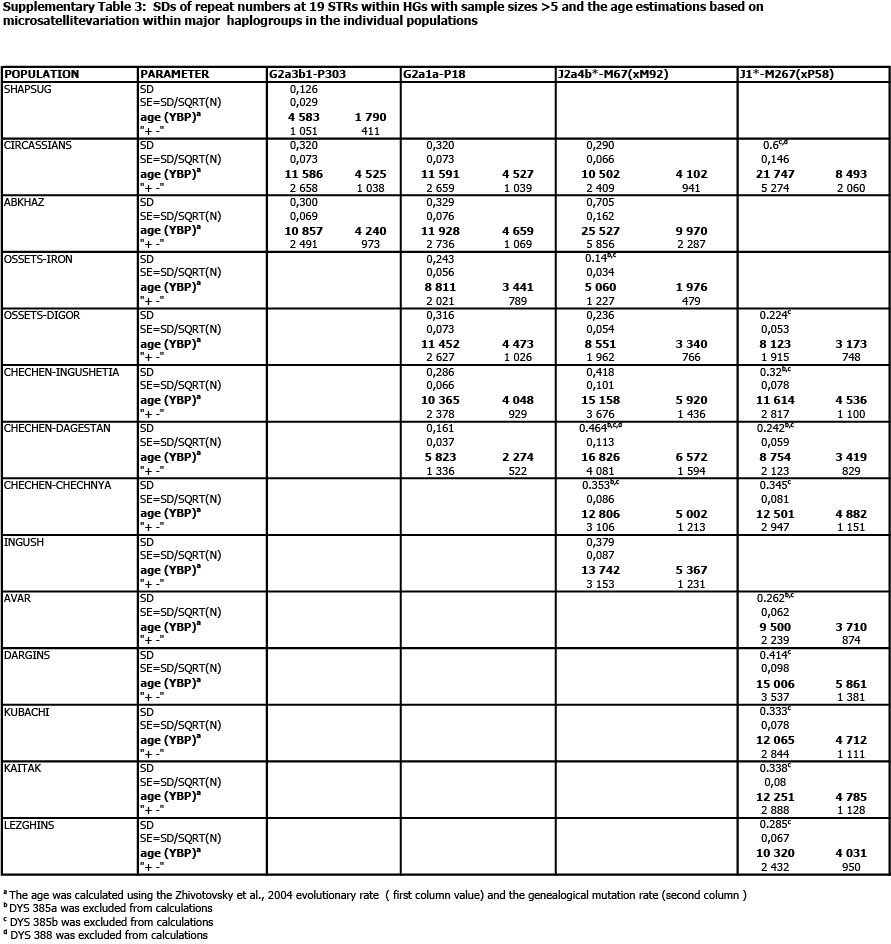
Источник: Balanovsky 2011. Supplementary Table 1. Лист Table S3
Coalescent times and median haplotypes for 11 R1b haplogroups
Источник: A major Y-chromosome haplogroup R1b Holocene era founder effect in Central and Western Europe. Myres 2010. Supplementary Table S2
Источник: A major Y-chromosome haplogroup R1b Holocene era founder effect in Central and Western Europe. Myres 2010. Supplementary Table S2
| Table S2: Coalescent times and median haplotypes for 11 R1b haplogroups | |||||||||||||||
| Median haplotypes by population | |||||||||||||||
| R1b Haplogroup | Population | N | TD | SE | Avg Var | D19 | D388 | D389I | D389II | D390 | D391 | D392 | D393 | D439 | A7.2 |
| M269* | Romania | 5 | 7,246 | 2,415 | 0,190 | 15 | 12 | 13 | 16 | 25 | 11 | 13 | 12 | 12 | 10 |
| Turkey | 10 | 9,058 | 2,370 | 0,228 | 14 | 12 | 13 | 16 | 24 | 11 | 13 | 12 | 11 | 10 | |
| Total | 31 | 11,173 | 2,386 | 0,251 | 14 | 12 | 13 | 16 | 25 | 11 | 13 | 12 | 12 | 10 | |
| L23* | Greece | 15 | 6,763 | 1,864 | 0,150 | 14 | 12 | 13 | 16 | 24 | 11 | 13 | 12 | 12 | 10 |
| Slovakia | 10 | 5,153 | 1,362 | 0,122 | 14 | 12 | 13 | 16 | 24 | 11 | 13 | 12 | 12 | 10 | |
| Switzerland | 10 | 7,246 | 1,871 | 0,151 | 14 | 12 | 13 | 15 | 24 | 11 | 14 | 12 | 12 | 10 | |
| Hungary | 7 | 5,952 | 1,812 | 0,171 | 14 | 12 | 13 | 17 | 24 | 11 | 13 | 12 | 12 | 10 | |
| Romania | 12 | 11,199 | 2,003 | 0,264 | 14 | 12 | 13 | 16 | 24 | 11 | 13 | 12 | 12 | 10 | |
| Caucasus | 32 | 12,217 | 2,301 | 0,292 | 14 | 12 | 13 | 16 | 24 | 11 | 13 | 12 | 12 | 10 | |
| Bashkir | 29 | 1,624 | 0,746 | 0,046 | 14 | 12 | 13 | 17 | 24 | 10 | 13 | 12 | 12 | 10 | |
| Pakistan | 5 | 14,493 | 3,241 | 0,410 | 14 | 12 | 13 | 16 | 24 | 11 | 13 | 12 | 12 | 10 | |
| Turkey | 58 | 11,057 | 1,953 | 0,277 | 14 | 12 | 13 | 16 | 24 | 11 | 13 | 12 | 12 | 10 | |
| Italy | 14 | 9,526 | 1,598 | 0,253 | 14 | 12 | 13 | 16 | 24 | 11 | 13 | 12 | 12,5 | 10 | |
| Poland | 7 | 3,106 | 1,144 | 0,081 | 14 | 12 | 13 | 17 | 24 | 11 | 13 | 12 | 12 | 10 | |
| Total | 214 | 10,093 | 1,783 | 0,248 | 14 | 12 | 13 | 16 | 24 | 11 | 13 | 12 | 12 | 10 | |
| M412* | Total | 14 | 5,694 | 1,534 | 0,149 | 14 | 12 | 13 | 16 | 24 | 11 | 13 | 13 | 12 | 10 |
| L11* | Germany | 6 | 9,481 | 3,926 | 0,247 | 14 | 12 | 13 | 16 | 24 | 10 | 13 | 13 | 12,5 | 11 |
| Total | 23 | 10,870 | 2,763 | 0,291 | 14 | 12 | 13 | 16 | 24 | 11 | 13 | 13 | 12 | 11 | |
| U106 all | Denmark | 20 | 6,789 | 1,657 | 0,161 | 14 | 12 | 13 | 16 | 23 | 11 | 13 | 13 | 12 | 11 |
| Estonia | 10 | 12,862 | 4,408 | 0,352 | 14 | 12 | 13 | 16 | 24 | 10,5 | 13 | 13 | 12 | 11 | |
| England | 26 | 7,037 | 1,794 | 0,179 | 14 | 12 | 13 | 16 | 23,5 | 11 | 13 | 13 | 12 | 11 | |
| France | 6 | 6,703 | 1,898 | 0,200 | 14 | 12 | 13 | 16 | 23,5 | 11 | 13 | 13 | 11 | 11 | |
| Germany | 66 | 8,480 | 2,111 | 0,203 | 14 | 12 | 13 | 16 | 23 | 11 | 13 | 13 | 12 | 11 | |
| Ireland | 6 | 8,756 | 2,226 | 0,243 | 14 | 12 | 13 | 16 | 23,5 | 11 | 13 | 13 | 12 | 11 | |
| Italy | 10 | 8,333 | 2,357 | 0,226 | 14 | 12 | 13 | 16 | 23 | 11 | 13 | 13 | 12 | 11 | |
| Netherlands | 30 | 7,005 | 1,987 | 0,177 | 14 | 12 | 13 | 16 | 23 | 11 | 13 | 13 | 12 | 11 | |
| Poland | 9 | 10,467 | 1,820 | 0,278 | 14 | 12 | 13 | 16 | 23 | 11 | 13 | 13 | 12 | 11 | |
| Slovakia | 11 | 9,552 | 3,488 | 0,249 | 14 | 12 | 13 | 16 | 24 | 11 | 13 | 13 | 12 | 11 | |
| Switzerland | 19 | 8,963 | 2,575 | 0,228 | 14 | 12 | 13 | 16 | 24 | 11 | 13 | 13 | 12 | 11 | |
| Total | 239 | 8,911 | 2,300 | 0,213 | 14 | 12 | 13 | 16 | 23 | 11 | 13 | 13 | 12 | 11 | |
| U106* | Slovakia | 11 | 9,552 | 3,488 | 0,249 | 14 | 12 | 13 | 16 | 24 | 11 | 13 | 13 | 12 | 11 |
| France | 6 | 6,703 | 1,898 | 0,200 | 14 | 12 | 13 | 16 | 23,5 | 11 | 13 | 13 | 11 | 11 | |
| Estonia | 10 | 12,862 | 4,408 | 0,352 | 14 | 12 | 13 | 16 | 24 | 10,5 | 13 | 13 | 12 | 11 | |
| Switzerland | 19 | 8,963 | 2,575 | 0,228 | 14 | 12 | 13 | 16 | 24 | 11 | 13 | 13 | 12 | 11 | |
| Denmark | 19 | 6,055 | 1,374 | 0,162 | 14 | 12 | 13 | 16 | 23,5 | 11 | 13 | 13 | 12 | 11 | |
| England | 23 | 7,089 | 2,304 | 0,171 | 14 | 12 | 13 | 16 | 24 | 11 | 13 | 13 | 12 | 11 | |
| Germany | 61 | 8,761 | 2,282 | 0,204 | 14 | 12 | 13 | 16 | 23 | 11 | 13 | 13 | 12 | 11 | |
| Ireland | 6 | 8,756 | 2,226 | 0,243 | 14 | 12 | 13 | 16 | 23,5 | 11 | 13 | 13 | 12 | 11 | |
| Italy | 10 | 8,333 | 2,357 | 0,226 | 14 | 12 | 13 | 16 | 23 | 11 | 13 | 13 | 12 | 11 | |
| Netherlands | 28 | 7,246 | 2,052 | 0,000 | 14 | 12 | 13 | 16 | 23 | 11 | 13 | 13 | 12 | 11 | |
| Poland | 9 | 10,467 | 1,820 | 0,278 | 14 | 12 | 13 | 16 | 23 | 11 | 13 | 13 | 12 | 11 | |
| Total | 228 | 9,056 | 2,416 | 0,215 | 14 | 12 | 13 | 16 | 23 | 11 | 13 | 13 | 12 | 11 | |
| U198 | Germany | 5 | 5,072 | 1,887 | 0,140 | 14 | 12 | 13 | 16 | 23 | 11 | 13 | 13 | 12 | 11 |
| Total | 11 | 5,929 | 1,537 | 0,155 | 14 | 12 | 13 | 16 | 23 | 11 | 13 | 13 | 12 | 11 | |
| S116 all | Bashkir | 8 | All same hapotype | 15 | 12 | 13 | 17 | 24 | 11 | 13 | 13 | 12 | 11 | ||
| Denmark | 16 | 7,382 | 2,644 | 0,167 | 14 | 12 | 13 | 16 | 24 | 11 | 13 | 13 | 12 | 11 | |
| England | 43 | 8,962 | 1,491 | 0,233 | 14 | 12 | 13 | 16 | 24 | 11 | 13 | 13 | 12 | 11 | |
| France | 40 | 10,097 | 2,081 | 0,268 | 14 | 12 | 13 | 16 | 24 | 11 | 13 | 13 | 12 | 11 | |
| Vaucluse | 20 | 11,270 | 3,289 | 0,307 | 14 | 12 | 13 | 16 | 24 | 11 | 13 | 13 | 12 | 11 | |
| Germany | 62 | 10,245 | 1,726 | 0,262 | 14 | 12 | 13 | 16 | 24 | 11 | 13 | 13 | 12 | 11 | |
| Greece | 7 | 6,729 | 2,321 | 0,162 | 14 | 12 | 13 | 16 | 24 | 11 | 13 | 13 | 13 | 11 | |
| Hungary | 9 | 9,259 | 2,753 | 0,256 | 14 | 12 | 13 | 16 | 24 | 11 | 13 | 13 | 12 | 11 | |
| Ireland | 73 | 8,152 | 1,910 | 0,208 | 14 | 12 | 13 | 16 | 24 | 11 | 13 | 13 | 12 | 11 | |
| Italy | 72 | 7,637 | 1,310 | 0,198 | 14 | 12 | 13 | 16 | 24 | 11 | 13 | 13 | 12 | 11 | |
| Netherlands | 14 | 7,565 | 1,659 | 0,196 | 14 | 12 | 13 | 16 | 24 | 11 | 13 | 13 | 12 | 11 | |
| Poland | 6 | 9,058 | 2,738 | 0,270 | 14 | 12 | 13 | 16 | 24 | 10 | 13 | 13 | 12 | 11 | |
| Romania | 11 | 7,576 | 3,296 | 0,169 | 14 | 12 | 13 | 16 | 24 | 11 | 13 | 13 | 12 | 11 | |
| Slovakia | 20 | 8,152 | 2,717 | 0,224 | 14 | 12 | 13 | 16 | 24 | 11 | 13 | 13 | 12 | 11 | |
| Slovenia | 7 | 9,317 | 2,289 | 0,267 | 14 | 12 | 13 | 16 | 24 | 11 | 13 | 13 | 12 | 11 | |
| Sweden | 10 | 6,159 | 1,625 | 0,172 | 14 | 12 | 13 | 16 | 24 | 11 | 13 | 13 | 12 | 11 | |
| Switzerland | 48 | 8,610 | 1,837 | 0,231 | 14 | 12 | 13 | 16 | 24 | 11 | 13 | 13 | 12 | 11 | |
| Turkey | 5 | 13,043 | 3,711 | 0,330 | 14 | 12 | 13 | 16 | 24 | 11 | 13 | 13 | 12 | 12 | |
| Total | 481 | 8,742 | 1,551 | 0,229 | 14 | 12 | 13 | 16 | 24 | 11 | 13 | 13 | 12 | 11 | |
| S116* | Slovakia | 12 | 8,152 | 2,702 | 0,214 | 14 | 12 | 13 | 16 | 24 | 11 | 13 | 13 | 12 | 11 |
| France | 19 | 11,745 | 3,113 | 0,302 | 14 | 12 | 13 | 16 | 24 | 11 | 13 | 13 | 12 | 11 | |
| Vaucluse | 12 | 13,889 | 4,682 | 0,382 | 14 | 12 | 13 | 16 | 24 | 11 | 13 | 13 | 12 | 11 | |
| Switzerland | 16 | 11,096 | 2,276 | 0,285 | 14 | 12 | 13 | 16 | 24 | 11 | 13 | 13 | 12 | 11 | |
| Denmark | 6 | 5,737 | 2,133 | 0,160 | 14 | 12 | 13 | 16 | 24 | 11 | 13 | 13 | 11,5 | 11 | |
| England | 8 | 6,470 | 2,178 | 0,186 | 14 | 12 | 13,5 | 16 | 24 | 11 | 13 | 13 | 12 | 11 | |
| Germany | 22 | 10,211 | 2,123 | 0,259 | 14 | 12 | 13 | 16 | 24 | 11 | 13 | 13 | 12 | 11 | |
| Ireland | 14 | 6,370 | 1,449 | 0,169 | 14 | 12 | 13 | 16 | 24 | 11 | 13 | 13 | 12 | 11 | |
| Italy | 14 | 7,007 | 2,586 | 0,191 | 14 | 12 | 13 | 16 | 24 | 11 | 13 | 13 | 12 | 11 | |
| Netherlands | 6 | 10,024 | 2,416 | 0,273 | 14 | 12 | 13 | 16 | 24 | 11 | 13 | 13 | 12 | 11 | |
| Total | 146 | 9,485 | 1,990 | 0,246 | 14 | 12 | 13 | 16 | 24 | 11 | 13 | 13 | 12 | 11 | |
| U152 | Greece | 7 | 6,729 | 2,321 | 0,162 | 14 | 12 | 13 | 16 | 24 | 11 | 13 | 13 | 13 | 11 |
| Slovakia | 7 | 9,317 | 4,486 | 0,195 | 14 | 12 | 13 | 16 | 24 | 11 | 13 | 13 | 11 | 11 | |
| France | 14 | 8,282 | 2,308 | 0,232 | 14 | 12 | 13 | 16 | 24 | 11 | 13 | 13 | 12 | 11 | |
| Vaucluse | 5 | 5,254 | 1,918 | 0,125 | 14 | 12 | 13 | 16 | 24 | 10 | 13 | 13 | 12 | 11 | |
| Switzerland | 29 | 6,577 | 1,776 | 0,177 | 14 | 12 | 13 | 16 | 24 | 11 | 13 | 13 | 12 | 11 | |
| Romania | 6 | 6,944 | 2,114 | 0,187 | 14 | 12 | 13 | 16 | 24 | 11 | 13 | 13 | 12,5 | 11 | |
| Bashkir | 8 | All same hapotype | 15 | 12 | 13 | 17 | 24 | 11 | 13 | 13 | 12 | 11 | |||
| England | 9 | 8,454 | 2,281 | 0,228 | 14 | 12 | 13 | 16 | 24 | 11 | 13 | 13 | 12 | 11 | |
| Germany | 33 | 9,566 | 1,898 | 0,252 | 14 | 12 | 13 | 16 | 24 | 11 | 13 | 13 | 12 | 11 | |
| Italy | 57 | 7,769 | 1,339 | 0,198 | 14 | 12 | 13 | 16 | 24 | 11 | 13 | 13 | 12 | 11 | |
| Poland | 5 | 6,522 | 1,691 | 0,180 | 14 | 12 | 13 | 16 | 24 | 10 | 13 | 13 | 12 | 11 | |
| Slovenia | 6 | 8,454 | 2,053 | 0,233 | 14 | 12 | 13 | 16 | 24 | 11 | 13 | 13 | 12 | 11 | |
| Total | 206 | 8,244 | 1,376 | 0,218 | 14 | 12 | 13 | 16 | 24 | 11 | 13 | 13 | 12 | 11 | |
| M529 all | Denmark | 7 | 9,231 | 3,943 | 0,199 | 14 | 12 | 13 | 16 | 24 | 11 | 13 | 13 | 12 | 11 |
| England | 26 | 9,476 | 2,167 | 0,241 | 14 | 12 | 13 | 16 | 24 | 11 | 13 | 13 | 12 | 11 | |
| France | 7 | 9,317 | 2,536 | 0,248 | 14 | 12 | 13 | 16 | 24 | 11 | 13 | 13 | 12 | 11 | |
| Germany | 7 | 8,972 | 2,209 | 0,214 | 14 | 12 | 13 | 16 | 24 | 11 | 13 | 13 | 12 | 11 | |
| Ireland | 57 | 8,824 | 2,251 | 0,223 | 14 | 12 | 13 | 16 | 24 | 11 | 13 | 13 | 12 | 11 | |
| Netherlands | 5 | 5,797 | 1,449 | 0,150 | 14 | 12 | 13 | 16 | 24 | 11 | 13 | 13 | 12 | 11 | |
| Sweden | 7 | 6,729 | 1,553 | 0,186 | 14 | 12 | 13 | 16 | 24 | 11 | 13 | 13 | 12 | 11 | |
| Total | 129 | 8,691 | 1,649 | 0,223 | 14 | 12 | 13 | 16 | 24 | 11 | 13 | 13 | 12 | 11 | |
| M529* | Denmark | 7 | 9,231 | 3,943 | 0,199 | 14 | 12 | 13 | 16 | 24 | 11 | 13 | 13 | 12 | 11 |
| England | 20 | 8,514 | 1,911 | 0,226 | 14 | 12 | 13 | 16 | 24 | 11 | 13 | 13 | 12 | 11 | |
| France | 6 | 9,662 | 3,013 | 0,253 | 14 | 12 | 13 | 16 | 24 | 11 | 13 | 13 | 12 | 11 | |
| Germany | 6 | 7,790 | 2,050 | 0,200 | 14 | 12 | 13 | 16 | 24 | 11 | 13 | 13 | 12 | 11,5 | |
| Ireland | 41 | 8,081 | 2,160 | 0,219 | 14 | 12 | 13 | 16 | 24 | 11 | 13 | 13 | 12 | 11 | |
| Netherlands | 5 | 5,797 | 1,449 | 0,150 | 14 | 12 | 13 | 16 | 24 | 11 | 13 | 13 | 12 | 11 | |
| Sweden | 7 | 6,729 | 1,553 | 0,186 | 14 | 12 | 13 | 16 | 24 | 11 | 13 | 13 | 12 | 11 | |
| Total | 105 | 8,146 | 1,643 | 0,216 | 14 | 12 | 13 | 16 | 24 | 11 | 13 | 13 | 12 | 11 | |
| M222 | England | 6 | 3,321 | 1,455 | 0,090 | 14 | 12 | 13 | 16 | 25 | 11 | 14 | 13 | 12 | 11,5 |
| Ireland | 16 | 3,865 | 1,584 | 0,095 | 14 | 12 | 13 | 16 | 25 | 11 | 14 | 13 | 12 | 11 | |
| Total | 24 | 3,800 | 1,217 | 0,095 | 14 | 12 | 13 | 16 | 25 | 11 | 14 | 13 | 12 | 11 | |
| M478/DYS390=19 | Bashkir | 10 | 0,362 | 0,362 | 0,010 | 14 | 12 | 14 | 16 | 19 | 10 | 13 | 13 | 13 | 10 |
| Total | 14 | 1,553 | 1,105 | 0,044 | 14 | 12 | 14 | 16 | 19 | 10 | 13 | 13 | 13 | 10 | |
| M478/DYS390>19 | Balkar | 9 | 4,026 | 1,697 | 0,094 | 14 | 12 | 14 | 19 | 22 | 11 | 13 | 13 | 13 | 10 |
| Total | 13 | 8,919 | 4,151 | 0,201 | 14 | 12 | 14 | 19 | 22 | 11 | 13 | 13 | 13 | 10 | |
| 1. A single S116* haplotype from Vaucluse displayed DYS38II=20 whereas all other samples in this group displayed DYS389B=16. Excluding the | |||||||||||||||
| DYS389B=20 allele yielded a Td=9.058 +/- 2.882 kya and an average variance of 0.083. | |||||||||||||||
Table 3 Estimated TMRCA of E1b1a UEP dates and distribution of E1b1a component haplogroups in sub-Saharan Africa
Источник: Evidence from Y-chromosome analysis for a late exclusively eastern expansion of the Bantu-speaking people. Pour 2013
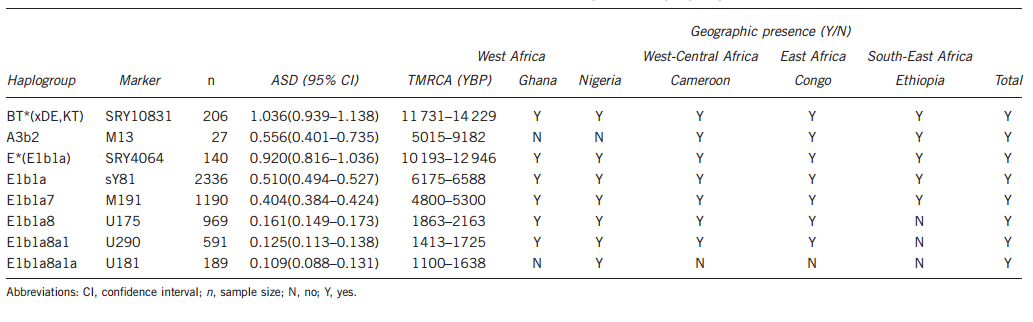
Источник: Evidence from Y-chromosome analysis for a late exclusively eastern expansion of the Bantu-speaking people. Pour 2013
Table 3 15 Y-STRs diversity of haplogroups C and O3 in East Asian populations
Источник: High frequencies of Y-chromosome haplogroup O2b-SRY465 lineages in Korea: a genetic perspective on the peopling of Korea. Kim 2011
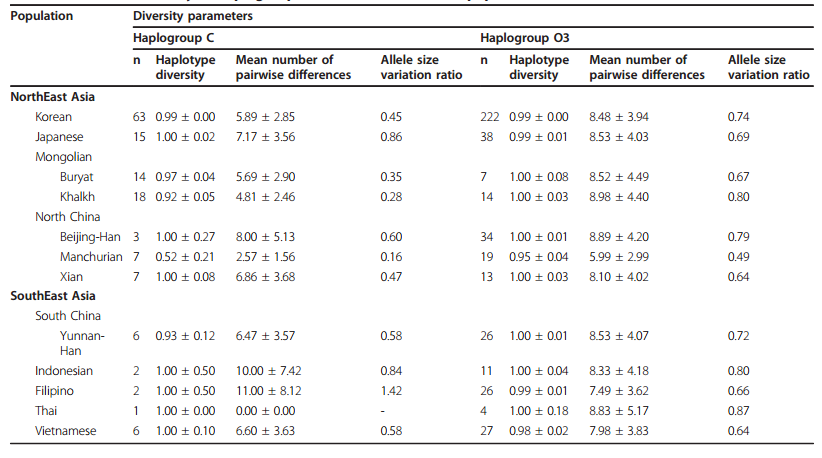
Источник: High frequencies of Y-chromosome haplogroup O2b-SRY465 lineages in Korea: a genetic perspective on the peopling of Korea. Kim 2011
Supplementary Table 4 Coalescence times for the Y chromosome haplogroups J1 (and subhaplogroups) and J2a2* in the Caucasus and neighboring regions/populations.
Источник: Таблица в формате EXCEL | The Caucasus as an Asymmetric Semipermeable Barrier to Ancient Human Migrations. Yunusbayev 2012
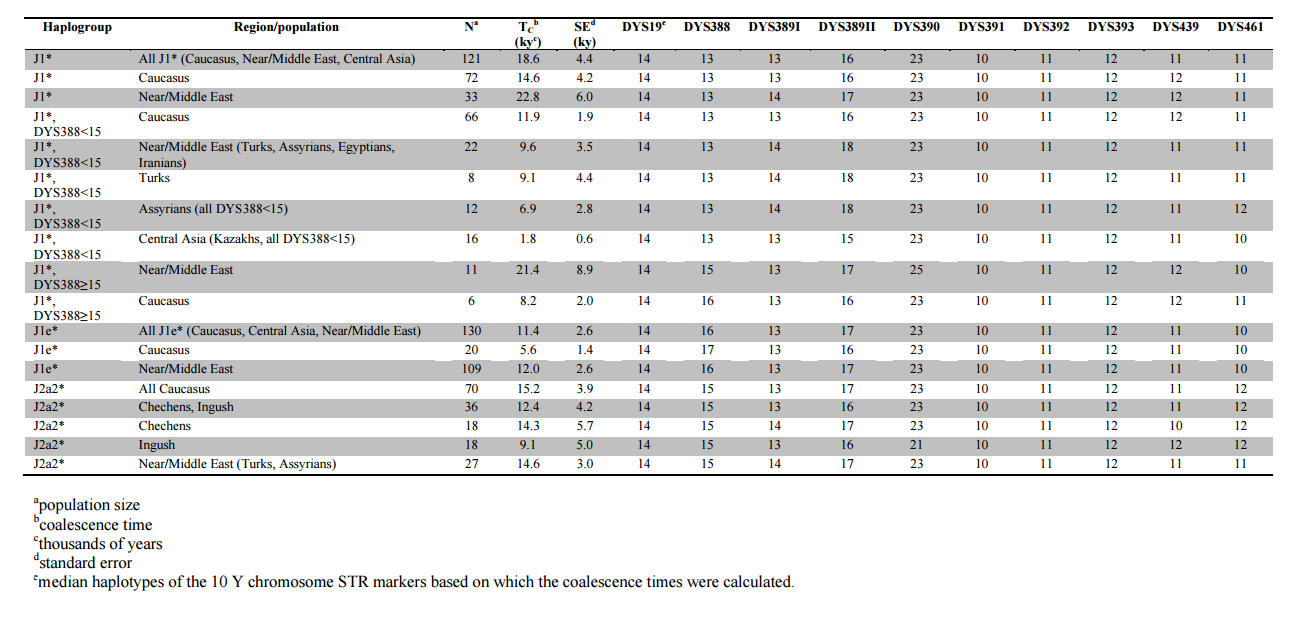
Источник: Таблица в формате EXCEL | The Caucasus as an Asymmetric Semipermeable Barrier to Ancient Human Migrations. Yunusbayev 2012
Additional file 3. Ages of the main Y-chromosome haplogroups in the samples of the present study together with relevant comparative data from Sengupta et al. Tharus, Indians, Hindus, Andhra Pradesh, Dravidian tribals, Tibeto-Burman tribals
Источник: Mitochondrial and Y-chromosome diversity of the Tharus (Nepal): a reservoir of genetic variation. Fornarino 2009
Источник: Mitochondrial and Y-chromosome diversity of the Tharus (Nepal): a reservoir of genetic variation. Fornarino 2009
| Additional file 3. Ages of the main Y-chromosome haplogroups in the samples of the present study together with relevant comparative data from Sengupta et al.[15] | ||||||
| Haplogroup | N chrs | Variance | Age | σ | Reference | |
| Population | ||||||
| H-69 | 60 | 0,601 | 26,8 | + | 6,0 | present paper |
| H-69* | 16 | 0,635 | 24,5 | + | 9,8 | " " |
| Indians pooled | 29 | 0,727 | 30,4 | + | 7,7 | Sengupta et al. [15] |
| H1-M52 | ||||||
| Indians | 15 | 0,253 | 10,2 | + | 3,9 | " " |
| Hindus | 10 | 0,286 | 12,7 | + | 5,2 | " " |
| Indians pooled | 144 | 0,271 | 10,6 | + | 1,8 | Sengupta et al. [15] |
| H1a-M82* | ||||||
| Tharus | 20 | 0,093 | 3,6 | + | 1,3 | present paper |
| Tharus-C II | 14 | 0,078 | 3,1 | + | 1,4 | " " |
| Indians | 11 | 0,107 | 4 | + | 1,1 | " " |
| Hindus | 6 | 0,110 | 4,5 | + | 1,6 | " " |
| Andhra Pradesh | 5 | 0,093 | 3,4 | + | 1,5 | " " |
| H2-APT | ||||||
| Tharus-C II | 9 | 0,286 | 12,6 | + | 6,5 | present paper |
| Dravidian tribals | 9 | 0,194 | 11,3 | + | 6,4 | Sengupta et al. [15] |
| J2a-M410* | ||||||
| Tharus | 17 | 0,346 | 14,3 | + | 4,9 | present paper |
| Tharus-C I | 6 | 0,133 | 4,8 | + | 2,3 | " " |
| Tharus-C II | 6 | 0,240 | 9,7 | + | 3,3 | " " |
| Tharus-E | 5 | 0,485 | 17,6 | + | 11,5 | " " |
| Indians pooled | 26 | 0,339 | 14,3 | + | 3,0 | Sengupta et al. [15] |
| J2b2-M241* | ||||||
| Tharus | 7 | 0,437 | 18,3 | + | 6,2 | present paper |
| Indians pooled | 38 | 0,328 | 13,8 | + | 3,8 | Sengupta et al. [15] |
| L1-M76 | ||||||
| Tribals pooled | 6 | 0,141 | 5,1 | + | 1,8 | present paper |
| Dravidian tribals | 10 | 0,168 | 6 | + | 2,4 | Sengupta et al. [15] |
| Indians pooled | 46 | 0,243 | 9,1 | + | 1,9 | " " |
| O3a3c-M134* | ||||||
| Tharus | 57 | 0,247 | 9,7 | + | 2,8 | present paper |
| Tibeto-Burman tribals | 57 | 0,229 | 9,3 | + | 2,7 | Sengupta et al. [15] |
| O3a3c1-M117 | ||||||
| Tharus | 55 | 0,136 | 5,5 | + | 2,1 | present paper |
| Tharus-C I | 28 | 0,108 | 4,7 | + | 2,1 | " " |
| Tharus-C II | 22 | 0,145 | 5,8 | + | 2,4 | " " |
| Tharus-E | 5 | 0,210 | 7,6 | + | 1,5 | " " |
| R1a1-M17* | ||||||
| Tharus | 14 | 0,399 | 16,6 | + | 3,9 | present paper |
| Tharus-C (I + II) | 9 | 0,210 | 8,3 | + | 2,2 | " " |
| Tharus-E | 5 | 0,500 | 20,3 | + | 9,1 | " " |
| Indians | 42 | 0,450 | 17,6 | + | 3,8 | " " |
| Indians pooled | 114 | 0,291 | 14 | + | 3,1 | Sengupta et al.[15] |
| Hindus | 34 | 0,310 | 14 | + | 4,1 | present paper |
| Andhra Pradesh | 8 | 0,988 | 37,7 | + | 21,5 | |
| R2-M124 | ||||||
| Tharus | 8 | 0,271 | 10,6 | + | 4,8 | present paper |
| Tharus-C II | 6 | 0,033 | 1,2 | + | 0,8 | " " |
| Indians | 13 | 0,355 | 12,8 | + | 3,0 | " " |
| Indians pooled | 68 | 0,284 | 11,6 | + | 2,1 | Sengupta et al. [15] |
| Hindus | 11 | 0,360 | 13,1 | + | 3,1 | present paper |